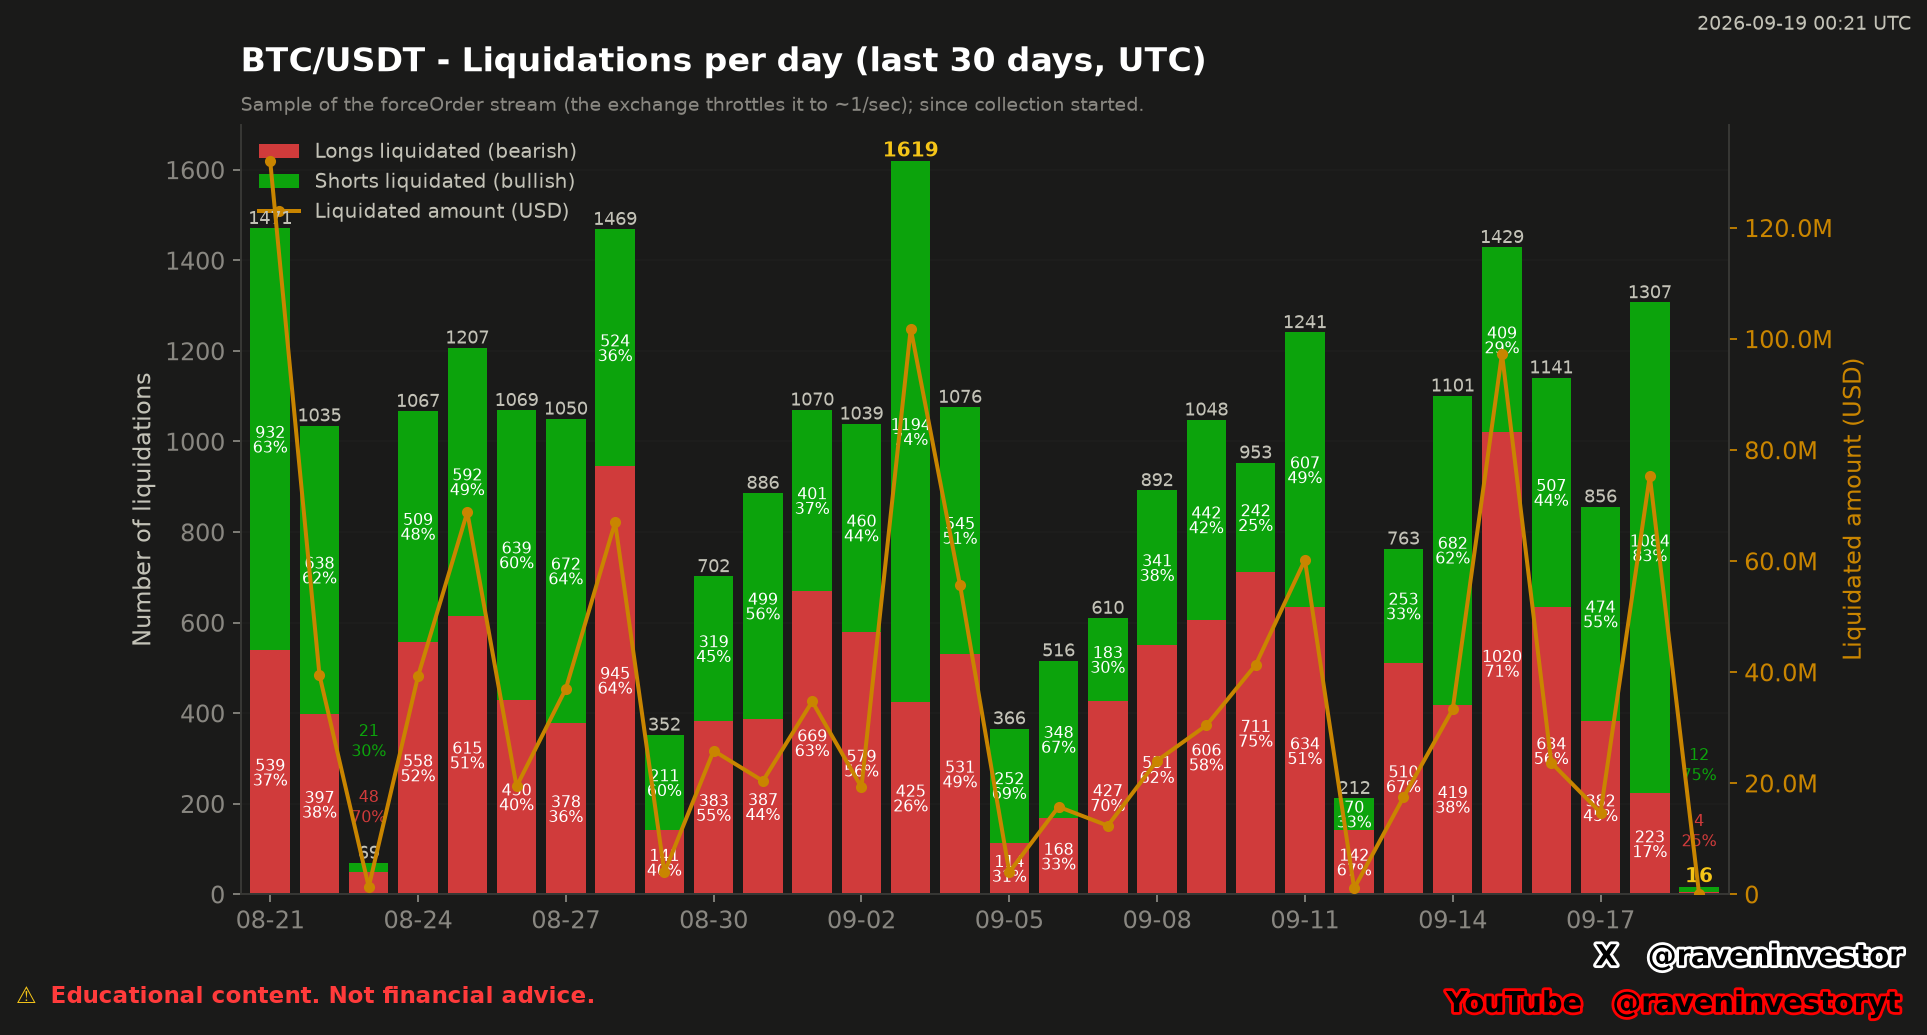
BTC/USDT: 27,632 Captured Liquidations, Not a Market-Wide Total
The 30-date UTC sample separates event counts from reported notional. September 3 leads by count, August 21 by amount, while the final date remains incomplete.
Read the analysisIndependent quantitative research
RavenInvestor turns structured market signals into clear, carefully sourced analysis—without hype or prediction theater.
The 30-date UTC sample separates event counts from reported notional. September 3 leads by count, August 21 by amount, while the final date remains incomplete.
Read the analysisLatest analysis
Our standard
Observed dataClearly separated from interpretation.
Reproducible methodsSources, timestamps, assumptions, and limitations.
No certainty claimsNo personalized advice and no guaranteed outcomes.
RavenInvestor Learn
Built to compound
RavenInvestor preserves significant market events as durable case studies. As the archive grows, future analysis can compare new conditions with transparent historical samples instead of relying on memory or generic commentary.
Read our methodology